Linkage Disequilibrium
Statistical dependence between genetic variants is called linkage disequilibrium (LD). LD is central to statistical genomics12.
The LD Matrix
- When we are interested in patterns of LD across a genomic region with \(n\) variants, it is convenient to report the LD matrix \(R\in\mathbb{R}^{n\times n}\), whose \((i,j)\) component is \(r_{i,j}\) the Pearson correlation between variant \(i\) and variant \(j\).
- While \(R\) usefully describes the LD structure of a region, it does not fully characterize the region's LD, because it contains only pairwise dependence information. There are many possible higher-order dependence structures consistent with any given \(R\) matrix3.
Haplotypes
The haplotype is an important concept in the study of LD. A haplotype is defined to be a group of genetic variants that are typically inherited together.
Drivers
There are two main drivers of LD: mutation and recombination.
Mutation
First consider LD in the absence of recombination, as occurs in mitochondrial DNA, certain regions of the Y chromosome, and some other genomic regions. In such recombination-free regions, the distance between two variants is irrelevant to their LD. Instead, LD depends on patterns of historical mutation.
The diagram below illustrates this concept: variants are correlated if the mutations that produced them occurred on the same branch of the haplotype genealogical tree. Genomic position is irrelevant.
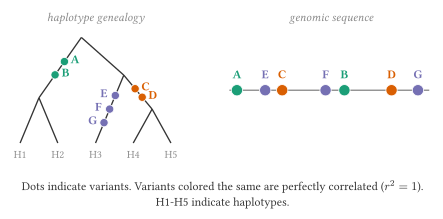
For further discussion of the LD in the absence of recombination, see Figure 7 from the HapMap paper5.
Recombination
Besides mutation, the other major driver of LD in the eukaryotic genome is recombination. In regions subject to recombination, LD decays as the distance between variants increases, because the odds of an intervening recombination event correspondingly increase. However, due to the complex structure of eukaryotic DNA, the odds of recombination events are non-uniform across a chromosome. Thus, the rate of LD decay with genomic distance is not constant. Instead, LD displays a block structure, with block boundaries determined by recombination hotspots.
As an illustrative example, here is a plot of the absolute value of the correlation between genetic variants in a region of chromosome 1. This plot was generated from the UK Biobank LD matrices stored on AWS OpenData. In the plot, the x and y axes correspond genomic position, while color indicates absolute correlation.
Consistent with the above, we observe irregularly spaced LD blocks.
Other Factors
Besides mutation and recombination, LD is affected by historical patterns of migration, population isolation, and natural selection.
Genomic Distance
It is frequently useful to measure distance along the genome not in base pairs, but in recombination frequency. For this purpose, the preferred unit is the centimorgan. Two genomic positions are one centimorgan apart if there is 1% chance of a recombination event between them per generation4.
Genotyping
The strong linkage disequilibrium between variants in close proximity means that it is possible to capture a large proportion of common human genetic variation without sequencing all variants. Instead, researchers can genotype a set of carefully chosen common variants called "tag variants". Un-genotyped common variants can be imputed with high accuracy from their LD with tag variants.
-
For an overview of linkage disequilibrium with reference to population genomic models like the famous coalescent see chapter 2 of the Handbook of Statistical Genomics6. ↩
-
As noted in chapter 2 of the Handbook of Statistical Genomics, the word "disequilibrium" in "linkage disequilibrium" is somewhat inaccurate, in the sense that statistical dependence between variants occurs in population-genetic equilibrium. ↩
-
The following example is illustrative. Consider 3 variants A, B and C. If all 3 variants are independent, the correlation matrix \(R\) will equal the identity matrix. If A and B are independent, but C is the exclusive or of A and B, their correlation matrix is also the identity matrix. ↩
-
For a readable popular-science account of the early history of genetics and the development of the centimorgan from the studies of fruit-fly mutants, see Time, Love, and Memory7. ↩
-
International HapMap Consortium. A haplotype map of the human genome. Nature, 437(7063):1299–1320, 2005. URL: https://www.nature.com/articles/nature04226. ↩
-
David J Balding, Ida Moltke, and John Marioni. Handbook of statistical genomics. John Wiley & Sons, 2019. URL: https://a.co/d/0jiiiZkz. ↩
-
Jonathan Weiner. Time, love, memory: a great biologist and his quest for the origins of behavior. Vintage, 2000. URL: https://a.co/d/01jzNaJx. ↩